
What is Online Dial Testing?
The majority of market researchers know what dial testing is. Most think of it in terms of our Perception Analyzer dials in the hands of respondents in a live focus group.
But over the past decade (and certainly over the past 2+ years), the acceleration of new tools and technologies are allowing researchers to conduct much of the qualitative research, that previously could only be done in-person, online. This goes for dial testing too.
What is online dial testing?
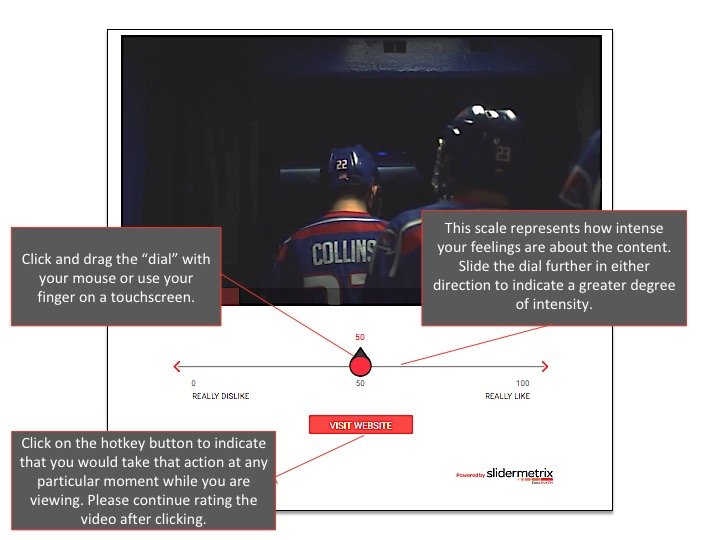
Like in-person dial testing, online dial testing uses technology to collect continuous moment-to-moment feedback while a respondent is viewing/experiencing some form of messaging, content or media. But unlike the Perception Analyzer dials, online dial testing uses an onscreen slider to simulate a handheld dial. The slider is located in close proximity to the test media so respondents can move the slider along the scale while viewing and/or listening.
How does online dial testing work?
Dialsmith’s online dial testing tools use an on-screen slider that respondents continuously move using a mouse or finger swipe (on touchscreens) to indicate how strongly they feel–either positively or negatively–in response to what they are seeing and hearing. So, the more the slider is moved to the right, the stronger the positive feeling. The more the slider is moved to the left, the stronger the negative feeling. The scale labels can be customized based on the question being asked to the respondents about the media item. Typical labels include: Dislike/Like, Disagree/Agree, Not Interested/Very Interested. The online dial testing tool records the slider position every second and then calculates average mean scores second-by-second for the total respondent group, as well as any sub-groups that are configured.
What do online dial testing results look like?
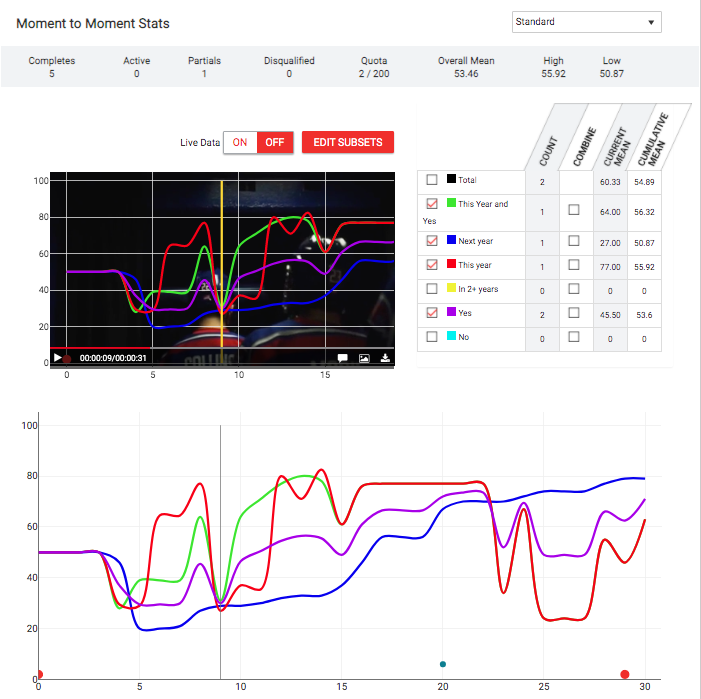
Similar to results from in-person dial testing, a line chart is created using the calculated mean scores for the slider position for every respondent. The chart is then overlaid on top of the playback of the media so researchers can see the movement in the lines in direct relation to the media content. Distinct lines are created for the Total as well as any sub-groups and calculated sub-groups that have been created. Researchers look for inflections or dramatic changes in the lines that may indicate abrupt swings in sentiment. They also look for divergencies in lines between sub-groups that would indicate that one sub-group is reacting to a specific message or segment of the media content very differently than another sub-group.
What can you test?
You can use Dialsmith’s online dial testing tools to evaluate most forms of recorded media. Anything from 30-second clips or advertisements to 45-minute (or longer) full-length tv shows, presentations, speeches, infomercials and more. Our tools have also been used to test audio content as well, such as radio host talent and music programming.
Want to see it in action for yourself?
You can view a demo of the respondent experience here, or get in touch if you’d like to schedule a full demo that shows the reporting as well.
And here’s a downloadable version of this post that you can share with colleagues and clients.


